androidplot
Charts and plots for Android
Pie Charts
Like all other primary chart and graph classes in Androidplot, PieChart is simply a composition
of widgets along with convenience methods. The real work is actually done by PieWidget.
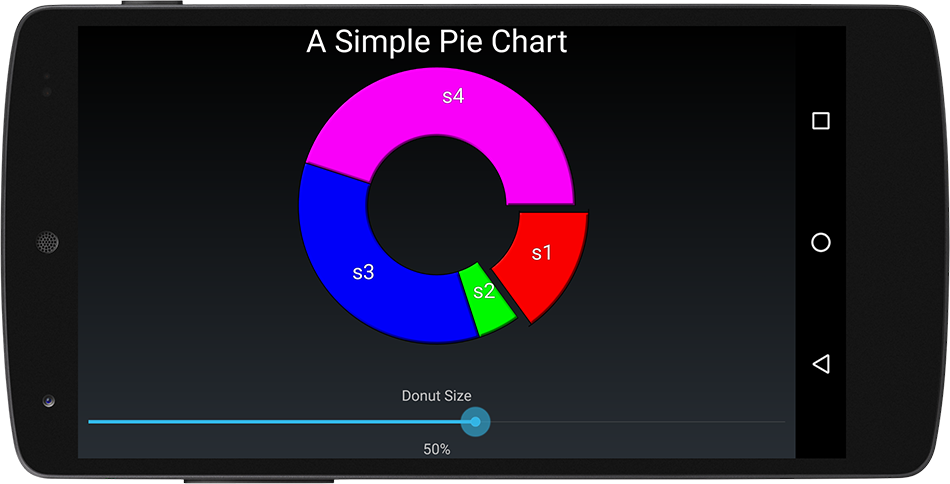
Basic Usage
Pie charts are composed of one or more values called Segments which combines a vaue and a label:
Segment segment = new Segment("my segment", 10);
Displaying a Segment to a pie chart also requires a SegmentFormatter. SegmentFormatter is what defines
the visual characteristics of the associated Segment; color, border thickness,
segment offset, label text style (if any) etc. The below code instantiates a new SegmentFormatter
with a segment color of red:
SegmentFormatter formatter = new SegmentFormatter(Color.RED);
Finally, the Segment must be added to the pie chart along with it’s SegmentFormatter:
pie.addSegment(segment, formatter);
Donut Size
By default, PieChart draws it’s self as a ring. The amount of empty space in the middle of
the pie is called the donutSize. Setting a donutSize of 0 causes the PieChart to draw it’s
self as a full circle.
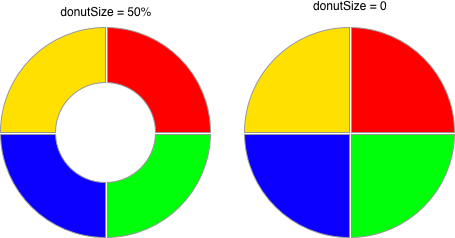
Setting donutSize programmatically:
// draw pie with an empty inner space radius equal to 50% of the pie's radius.
pieRenderer.setDonutSize(0.5, PieRenderer.DonutMode.PERCENT);

// donut size may also be expressed in pixels:
pieRenderer.setDonutSize(PixelUtils.dpToPix(30), PieRenderer.DonutMode.PIXELS);
Segment Orientation
Each Segment is drawn in the order it was added to the PieChart clockwise from startDegs
which by default is 0.
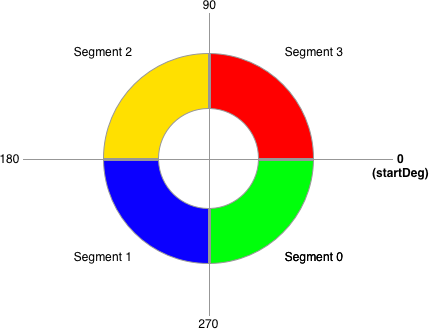
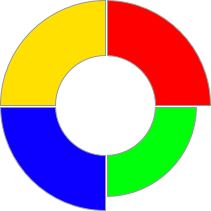
Using the image above, to move Segment0 to the Northeast quadrant
of the pie (currently occupied by Segment3) startDeg should be set to 90:
pie.getRenderer(PieRenderer.class).setStartDegs(90);
Extent
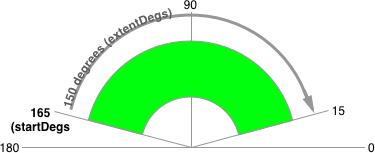
The extentDegs value determines the number of degrees running clockwise from startDegs that
represent 100% of the pie chart. The formal description is a little obtuse but is easy to understand
through example. You could for instance use extentDegs in conjunction with startDegs to represent
the full pie as a gauge:
// start the first segment at 5 degrees;
pie.getRenderer(PieRenderer.class).setStartDegs(165);
pie.getRenderer(PieRenderer.class).setExtentDegs(150);
Which produces a pie chart profile like this:
SegmentFormatter
As mentioned above, SegmentFormatter defines how a Segment is visually represented in a PieChart.
In addition to basic color / border line styling params, there are several parameters available
to visually distinguish a segment:
Offset
Value in pixels used to “shift” the position of the segment outward relative to the center of the PieChart.
The visual effect is equivalent to cutting up a pie and dragging one piece out and away from the rest of the pie:

RadialInset
Value in degrees used to shrink the radial edges of the segment inward. The visual effect is equivalent to shaving the edges off of a slice of pie, resulting in a narrower slice of pie:

InnerInset
Value in pixels used to shrink the inner section of the pie. The visual effect is equivalent to cutting the tip off of a slice of pie:

OuterInset
Value in pixels used to shrink the outer edge of the pie. The visual effect is equivalent to evenly shaving the crust off of a slice of pie:
See the DemoApp’s pie chart example source for a comprehensive usage example.