androidplot
Charts and plots for Android
Custom Renderers
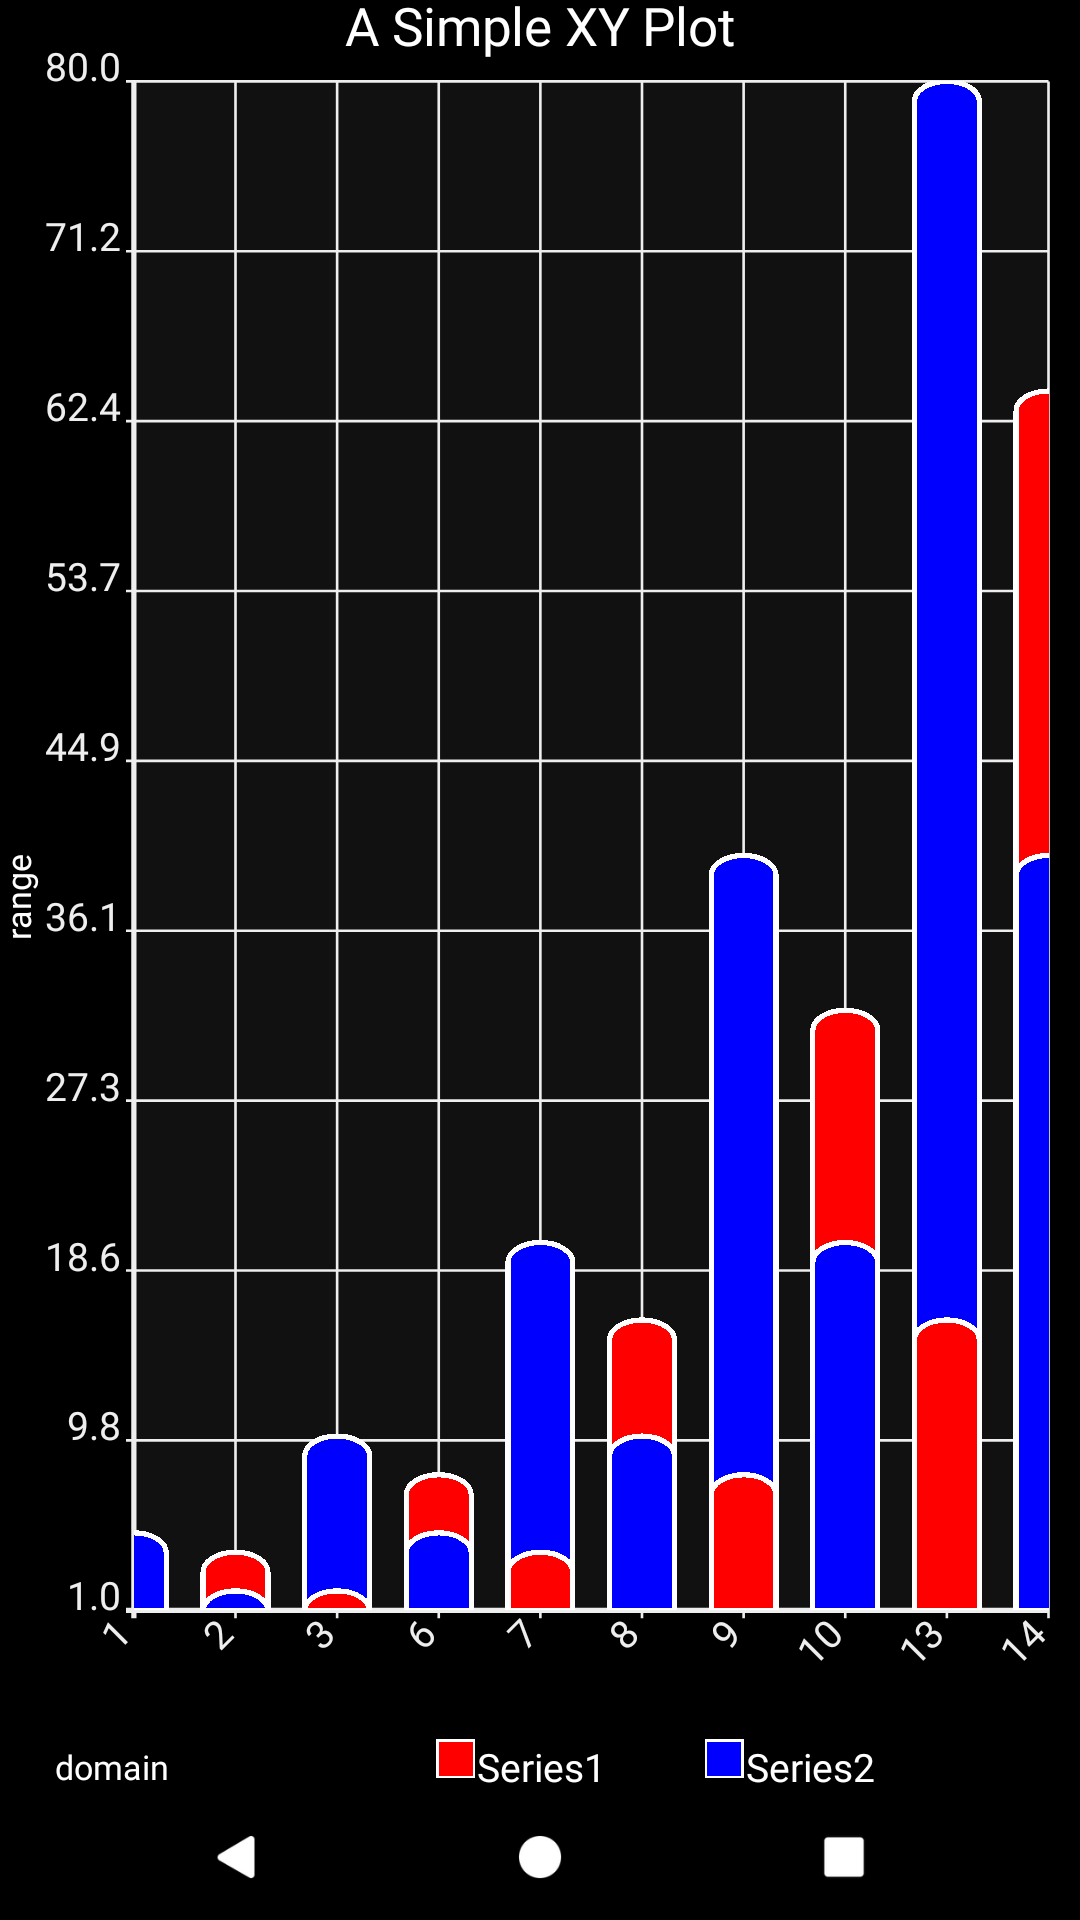
Androidplot renderers can be extended with extra functionality in the form of custom renderers.
For the example below we’ll look at creating a custom implementation of BarRenderer that will
draw bars with rounded edges. While this example demonstrates an XYPlot, the steps apply to
PieChart etc. as well.
Create the Formatter
The first step to creating a custom renderer is defining it’s Formatter. Aside from providing
the visual configuration used by the Renderer to draw series data, it’s also used by Androidplot
to map a series to a specific renderer type and if necessary, obtain a new instance of that renderer.
Here’s the most basic implementation:
class RoundedBarFormatter extends BarFormatter {

    {
        // for now we'll hardcode some formatting values.
        // a real implementation would probably provide a constructor instead
        getBorderPaint().setColor(Color.WHITE);
        getFillPaint().setColor(Color.RED);
    }

    @Override
    public Class<RoundedBarRenderer> getRendererClass() {
        return RoundedBarRenderer.class;
    }

    @Override
    public RoundedBarRenderer doGetRendererInstance(XYPlot xyPlot) {
        return new RoundedBarRenderer(xyPlot);
    }
}
Create the Renderer
All we want to do here is tweak the way BarRenderer behaves a little so we’ll use it as our base class:
class RoundedBarRenderer extends BarRenderer<RoundedBarFormatter> {

    public RoundedBarRenderer(XYPlot plot) {
        super(plot);
    }

    @Override
    protected void drawBar(Canvas canvas, Bar<RoundedBarFormatter> bar, RectF rect) {
        // TODO this is where we'll add our custom behavior
    }
}
In the case of our RoundedBarFormatter, the behavior we need to change all exits within the
drawBar(Canvas, Bar, RectF) method. The existing implementation uses Canvas.drawRect(...) to
draw bars. We could use a stroke with rounded edges, but this would cause the edges on both the top
and the bottom to be rounded, which won’t look right. We’ll draw using a path instead:
@Override
protected void drawBar(Canvas canvas, Bar<RoundedBarFormatter> bar, RectF rect) {

    // skip nulls:
    if(bar.getY() == null) {
        return;
    }

    RoundedBarFormatter formatter = getFormatter(bar.i, bar.series);
    if(formatter == null) {
        formatter = bar.formatter;
    }

    // don't need to draw if the bar lacks height or width:
    if (rect.height() > 0 && rect.width() > 0) {
        final Path path = new Path();
        final float arcHeightPx = 20;
        final float adjustedTop = rect.top + arcHeightPx;
        final RectF cap = new RectF(rect.left, rect.top, rect.right,rect.top + 2 * arcHeightPx);

        // start at bottom-left and move clock-wise around the shape:
        path.moveTo(rect.left, rect.bottom);
        path.lineTo(rect.left, adjustedTop);
        path.arcTo(cap, 180, 180, false);
        path.lineTo(rect.right, rect.bottom);
        path.close();

        canvas.drawPath(path, formatter.getFillPaint());
        canvas.drawPath(path, formatter.getBorderPaint());
    }
}
Use It
Using the new custom renderer is as easy as adding a series to a plot using RoundedBarFormatter:
plot.addSeries(series1, new RoundedBarFormatter(Color.RED));
plot.addSeries(series2, new RoundedBarFormatter(Color.BLUE));
Here’s what this would look like used in the demo app’s SimpleXYPlotActivity:
