androidplot
Charts and plots for Android
Bubble Charts
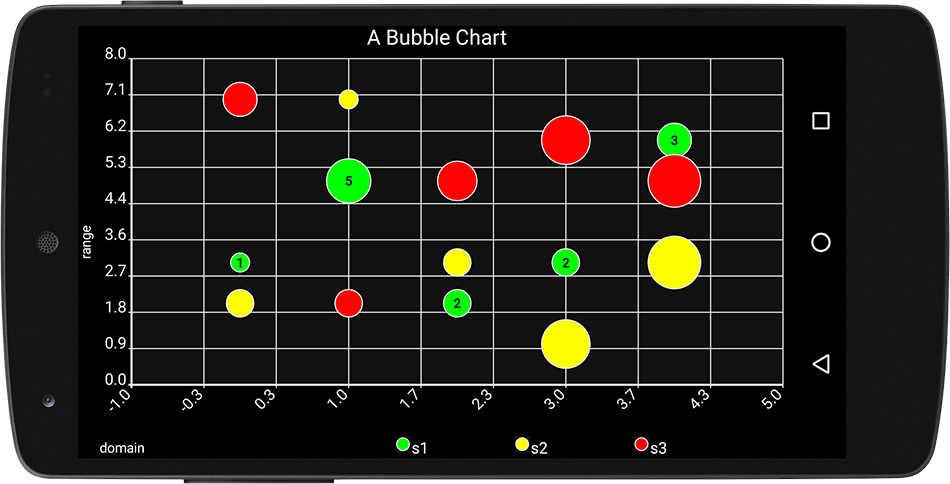
A BubbleChart is a two dimensional representation of three dimensional data
on an XYPlot, where the xy values are drawn as a circle with a radius representing the zVal.

Basic Usage
The first step in creating a BubbleChart is to define the data to be plotted. We’ll start
by creating an instance of BubbleSeries:
Using the implicit iVal for x:
BubbleSeries series1 = new BubbleSeries(
    Arrays.asList(new Number[]{3, 5, 2, 3, 6}),        // xCoordinate
    Arrays.asList(new Number[]{1, 5, 2, 2, 3}), "s1"); // yCoordinate
Or it’s equivalent four argument counterpart:
BubbleSeries bubbleSeries = new BubbleSeries(
    Arrays.asList(new Number[]{0, 1, 2, 3, 4}),        // xCoordinate
    Arrays.asList(new Number[]{3, 5, 2, 3, 6}),        // yCoordinate
    Arrays.asList(new Number[]{1, 5, 2, 2, 3}),        // zVal (corresponds to radius)
    "s1");
Next, create a Formatter defining the fill and outline colors of the bubbles:
// draw bubbles with a green fill and white outline:
BubbleFormatter formatter = new BubbleFormatter(Color.GREEN, Color.WHITE)
Finally, add the BubbleSeries to our plot as you would any other XYSeries instance:
plot.addSeries(bubbleSeries, formatter);
BubbleScaleMode
By default, BubbleRenderer scales each rendered bubble radius using the square root of it’s corresponding
zVal, preventing apparent size differences in each bubble radius from being visually misleading. See: https://en.wikipedia.org/wiki/Bubble_chart#Choosing_bubble_sizes_correctly
If you’d prefer to use a linear scale:
plot.getRenderer(BubbleRenderer.class).setBubbleScaleMode(BubbleRenderer.BubbleScaleMode.LINEAR);
Example
Check out the bubble chart example source for a full source example of a bubble chart.