androidplot
Charts and plots for Android
Bar Charts
Bar Charts are drawn with BarRenderer by converting xy values of an XYSeries into
vertical bars. The height of the vertical bar is calculated from the yVal and the base
of the bar is calculated from the plot’s range origin value.
Basic Usage
Rendering an XYSeries as a bar chart is as simple as adding the series to an XYPlot with an
instance of BarFormatter:
// create a bar formatter with a red fill color and a white outline:
BarFormatter bf = new BarFormatter(Color.RED, Color.WHITE);
plot.addSeries(series, bf);
BarRenderer
Unlike most other renderers, much of the visual configuration of a bar chart is configured through it’s BarRenderer.
BarRenderer provides methods for setting how the width of each bar should be calculated, the space between each Bar
and what style of visual grouping to use.
Getting the BarRenderer Instance
Many of the topics below require access to the BarRenderer instance to be set. Each instance of
XYPlot contains it’s own unique Renderer instances. To retrieve the BarRenderer
instance from an XYPlot:
BarRenderer renderer = plot.getRenderer(BarRenderer.class);
BarGroup
A BarGroup is automatically generated to group values from one or more series by their index values.
All Bar instances belong to a BarGroup, even if there is only a single XYSeries that exists.
A common use case of bar charts is to represent a group of two or more values for a given interval as individual bars, for example the number of wins and losses for a baseball team for every month over the course of a year.
To model this in Androidplot, create two instances of XYSeries; one for wins and one for losses, each
with exactly 12 elements (one for each day of the month):
XYSeries wins = new SimpleXYSeries(SimpleXYSeries.ArrayFormat.Y_VALS_ONLY, "wins", 3, 4, 5, 3, 2, 3, 5, 6, 2, 1, 3, 1);
XYSeries losses = new SimpleXYSeries(SimpleXYSeries.ArrayFormat.Y_VALS_ONLY, "losses", 0, 1, 1, 0, 1, 0, 0, 0, 2, 1, 0, 1);
Each series is then added to the plot with it’s own formatter:
// draw wins bars with a green fill:
BarFormatter winsFormatter = new BarFormatter(Color.GREEN, Color.BLACK);
plot.addSeries(wins, winsFormatter);

// draw losses bars with a red fill:
BarFormatter lossesFormatter = new BarFormatter(Color.RED, Color.BLACK);
plot.addSeries(losses, lossesFormatter);
The pairs of wins/losses bars are then drawn side-by-side for each of the 12 indexes. Androidplot
knows to do this because BarRenderer (the renderer used to draw series associated with a BarFormatter)
extends GroupRenderer.
BarRenderer Styles
BarRenderer provides three grouping styles that may be used when rendering two or more XYSeries:
OVERLAID, STACKED, SIDE_BY_SIDE
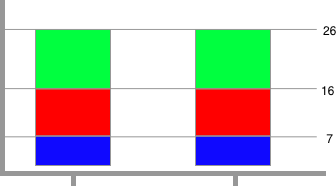
OVERLAID (default)
Bars in the same grouping are overlaid on each-other, the bars being drawn by yVal in descending order.
To use:
barRenderer.setBarOrientation(BarRenderer.BarOrientation.OVERLAID);
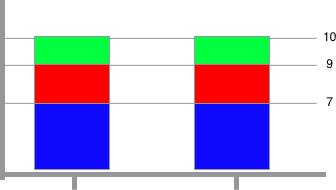
STACKED
Bars in the same group are stacked on top of each-other. Limitations:
- Range Origin must be set to 0.
- All
XYSeriesmust contain no negative values.
To use:
barRenderer.setBarOrientation(BarRenderer.BarOrientation.STACKED);
SIDE_BY_SIDE
Bars in the same group are drawn next to one another.
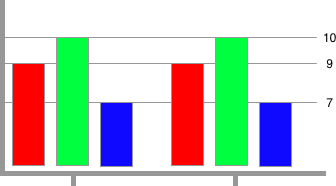
To use:
barRenderer.setBarOrientation(BarRenderer.BarOrientation.SIDE_BY_SIDE);
By default there is no spacing between bars in the same BarGroup in this mode. You can add spacing
by setting a left and right margin on your BarFormatter instances:
barFormatter.setMarginLeft(PixelUtils.dpToPix(1));
barFormatter.setMarginRight(PixelUtils.dpToPix(1));
BarGroup Widths & Spacing
When configuring BarGroup widths and spacing, there are two mutually exclusive methods that can be used;
FIXED_WIDTH and FIXED_GAP.
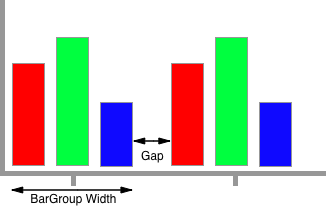
FIXED_WIDTH
The exact size of the BarGroup is specified in pixels and the space between each BarGroup
is dynamically calculated based on that size.
barRenderer.setBarGroupWidth(BarRenderer.BarGroupWidthMode.FIXED_WIDTH, PixelUtils.dpToPix(25));
FIXED_GAP
The exact size of the “gap” between each BarGroup is specified in pixels and the size of each BarGroup
is dynamically calculated based on that spacing.
barRenderer.setBarGroupWidth(BarRenderer.BarGroupWidthMode.FIXED_GAP, PixelUtils.dpToPix(5));
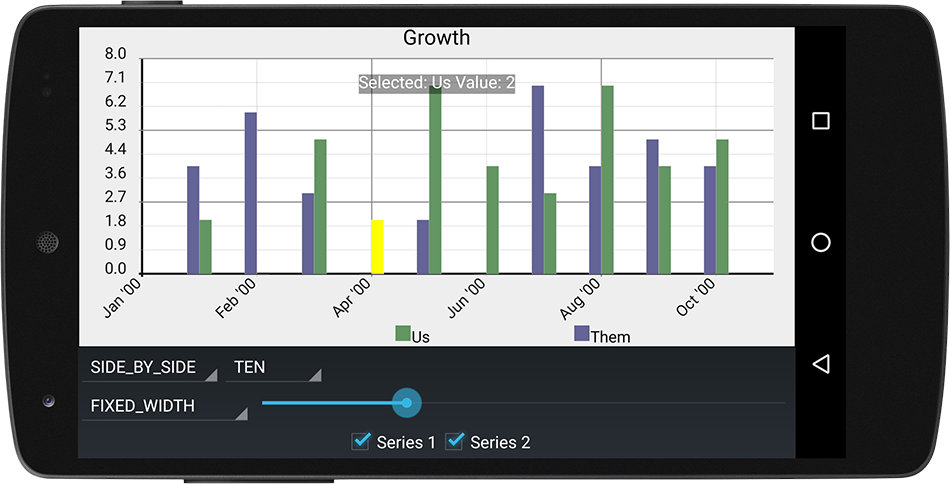
Example
See the DemoApp’s bar chart example source.